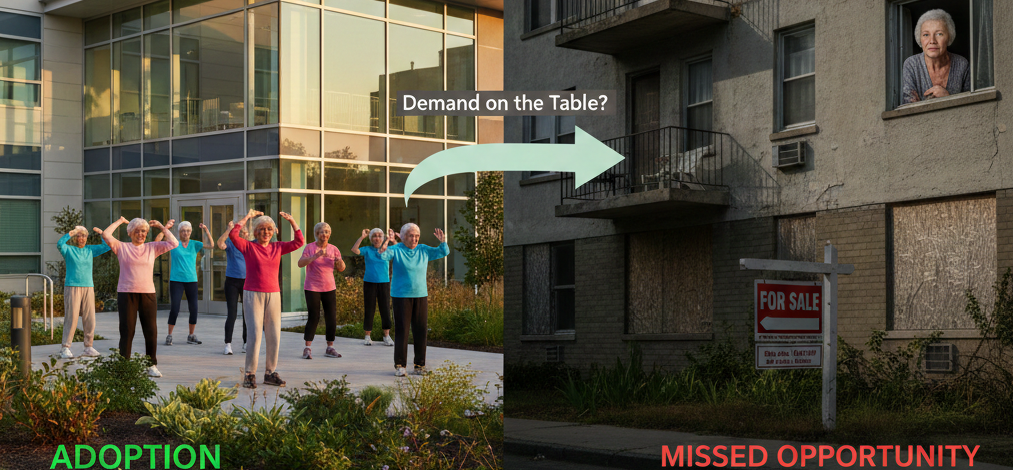
As Baby Boomers move deeper into their 80s, senior housing is entering a stretch unlike anything we’ve seen before. Demand is building. But when you step back and look across the 99 NIC MAP markets, a hard question jumps out:
Why do some metros consistently outperform on assisted living adoption while others lag far behind — even when demographics look similar?
Using the Assisted Living Occupied Penetration Rate
(Assisted Living Occupied Units / Households Aged 75+) × 100,
the data shows something important: penetration is not driven by one simple factor like wealth, age, or health. It’s the result of multiple forces lining up — or not lining up.
Structural factors set the ceiling. But culture, labor, and policy often decide how close a market gets to it.
The Six Pillars of Market Adoption
Looking at demographics alone will mislead you. Market performance depends on ecosystem alignment. From our analysis, six forces consistently shape outcomes:
1. Structural Foundations
Income levels and marital rates create capacity for adoption — but they don’t guarantee it. Roughly one-third of markets break the economic assumptions. Structure defines potential. Other forces determine whether that potential is realized.
2. Care Needs (The ADL Paradox)
Here’s the counterintuitive finding: higher ADL need often correlates with lower assisted living penetration.
Why? Lower-income seniors are more likely to make crisis-driven decisions and bypass assisted living altogether for higher-acuity settings. Higher-income seniors, by contrast, plan transitions proactively and enter earlier — before needs escalate.
Planning power matters.
3. Culture & Awareness
In many diverse regions, multigenerational caregiving remains the norm. Family takes care of family.
Meanwhile, in more homogeneous markets with decades of congregate living history, assisted living is normalized — sometimes even aspirational.
Perception shapes demand.
4. The Affordability Perception
The “middle market gap” is real — but often psychological.
Many seniors hesitate to liquidate home equity or feel like moving is a financial downgrade, even when the math works. Preserving inheritance weighs heavily in decisions.
Confidence, not just capital, is the barrier.
5. Workforce as the Growth Engine
Certified Nursing Assistants (CNAs) are the quiet growth engine of this industry.
Markets competing with hospitality, retail, or tourism for labor often struggle to stabilize frontline staff. Without workforce stability, penetration stalls — no matter how strong demand looks on paper.
6. The Policy Hinge
State-level Medicaid waivers and discharge rules can either unlock growth or choke it.
Strict discharge requirements increase operator risk and discourage early move-ins. Supportive waiver structures expand the addressable market and reduce middle-market gaps.
Policy isn’t background noise. It’s leverage.
Affordability: Perception vs. Reality
Affordability is cited as the primary barrier in nearly every market. But when we looked deeper, the data told a more nuanced story.
In 60 of the 99 markets studied, there is unoccupied inventory priced within reach of median-income 75+ households — when measured at the 5th percentile of asking rents.
And when affordability is evaluated using the 25th percentile rent instead of the average, the timeline a median-income senior can sustain a stay nearly doubles in some markets.
MarketAffordability (Average Rent)Affordability (25th Percentile Rent)Las Vegas, NV7 years, 4 months12 years, 6 monthsMiami, FL6 years, 5 months10 years, 6 monthsPortland, OR6 years, 5 months9 years, 11 monthsMinneapolis, MN6 years, 9 months11 years, 9 months
The inventory exists.
The issue is awareness, confidence, and messaging.
Bridging that perception gap is where real middle-market opportunity lives.
A Tale of Four Cities
Looking at contrasting markets makes the dynamics clearer.
High-Penetration Markets
Minneapolis, MN (10.1%)
Modern inventory (13-year median property age).
High not-for-profit presence (51%), creating quality benchmarks.
Strong CNA pipeline supported by a stable immigrant workforce.
This is ecosystem alignment in action.
Portland, OR (7.5%)
Longstanding community-based Medicaid waiver support.
Flexible discharge policies encourage earlier transitions.
Assisted living is viewed as a natural progression, not a last resort.
Policy and culture reinforce each other.
Lower-Penetration Markets
Las Vegas, NV (1.9%)
Transient “snowbird” population often returns home when needs escalate.
Strict discharge rules.
No Medicaid waiver support for assisted living.
That’s a structural middle-market squeeze.
Miami, FL (2.4%)
High home equity — but climate risk drives up insurance and development costs.
Strong cultural preference for family caregiving in Hispanic and Caribbean communities.
Cultural norms and economic pressures combine to slow adoption.
Workforce and Policy: The Quiet Drivers
Demographics get headlines. Workforce and regulation decide outcomes.
The industry will need approximately 660,000 additional workers by 2033.
Markets like Minneapolis (59 CNAs per 1,000 seniors) hold a meaningful advantage over markets like Las Vegas (40.5 CNAs per 1,000), where hospitality competes aggressively for the same labor pool.
On the policy side, Medicaid waivers, discharge flexibility, and CON structures shape supply, risk tolerance, and middle-market viability.
Oregon’s waiver framework expands access.
Nevada’s absence of waiver support constrains it.
That difference matters.
Conclusion: Penetration Reflects Ecosystem Health
Penetration is not simply a property-level metric. It’s a macro signal.
It reflects:
- Cultural normalization
- Workforce stability
- Policy flexibility
- Consumer confidence
- Product modernization
When those forces align, penetration rises.
When they conflict, adoption stalls — even in aging markets.
Strategic Implications
Operators:
Close the perception gap. Highlight attainable pricing tiers. Expand outreach to diverse communities.
Investors:
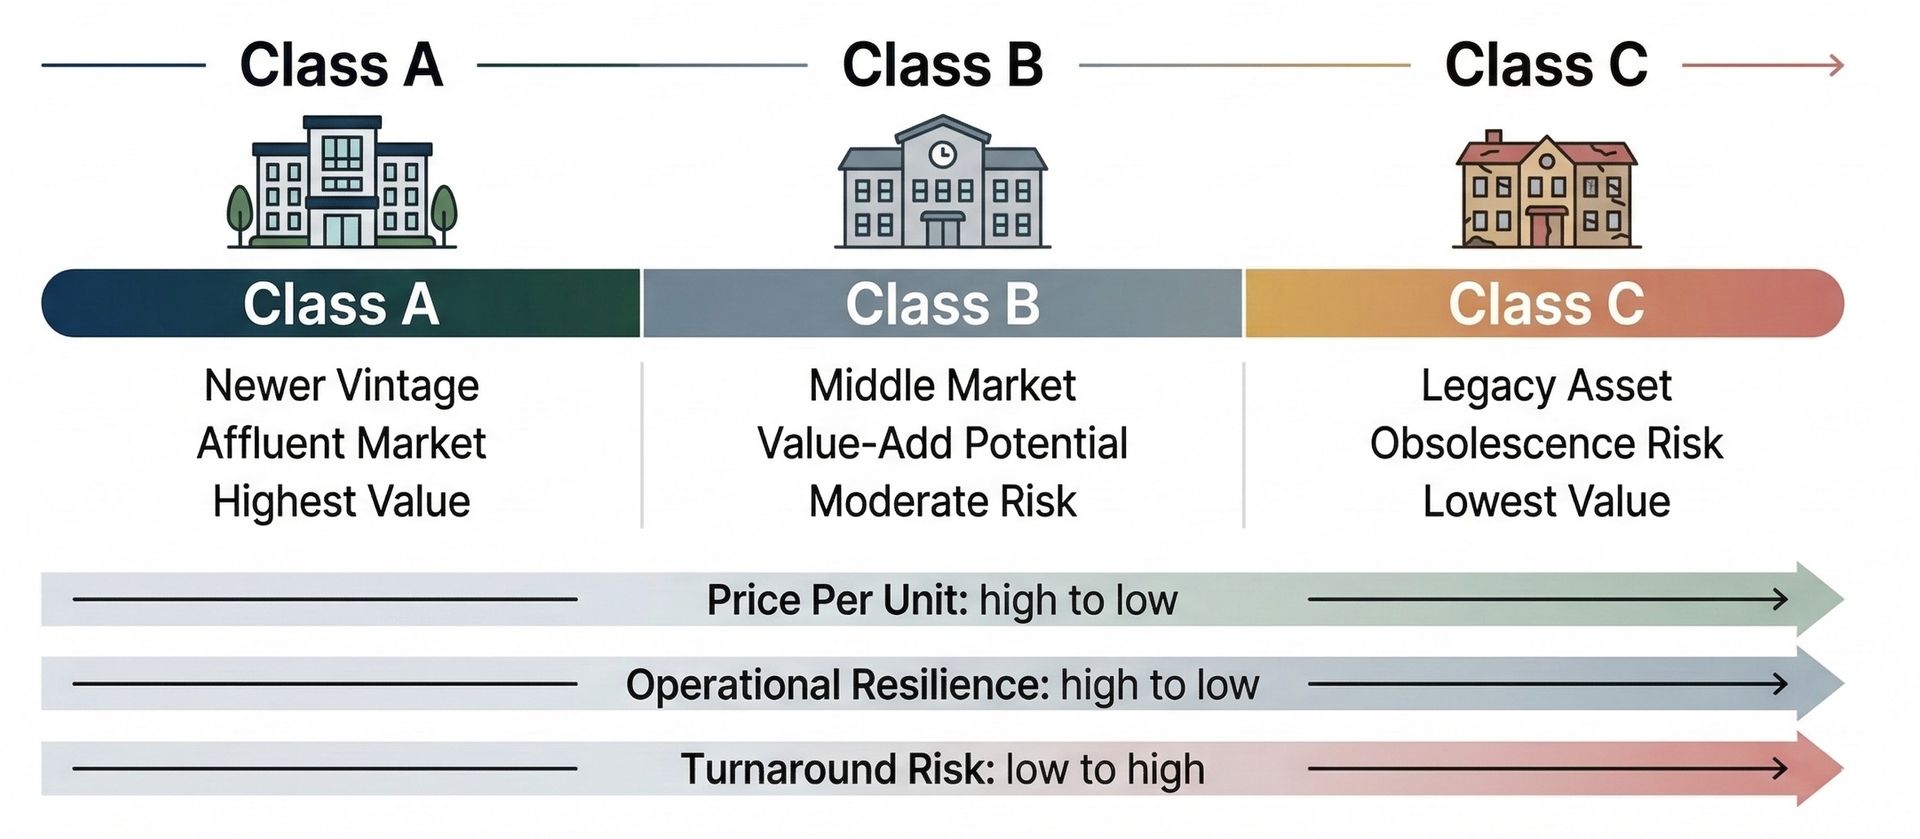
Look for modernization opportunities — particularly in lower-penetration markets where aging inventory suppresses adoption.
Policymakers:
Move beyond symbolic waiver programs. Implement flexible discharge standards and real financial pathways for middle-income seniors.
Assisted living performs best when it is positioned as a proactive quality-of-life decision — not a crisis response.
Markets that embrace that shift tend to win.
Appendix
Top 5 vs. Bottom 5 Markets by Penetration Rate
RankTop 5 MarketsRateBottom 5 MarketsRate1Minneapolis, MN10.1%McAllen, TX0.5%2Madison, WI8.8%El Paso, TX0.8%3Milwaukee, WI8.0%Birmingham, AL1.8%4Portland, OR7.5%Las Vegas, NV1.9%5Boise, ID7.2%New York, NY2.1%
Glossary
ADL (Activities of Daily Living): Core functions such as bathing, dressing, and eating that determine care eligibility.
CNA (Certified Nursing Assistant): Frontline caregivers; CNA density per 1,000 seniors is a proxy for workforce strength.
CON (Certificate of Need): Regulatory requirement proving market need before development.
Medicaid Waiver: State mechanism allowing Medicaid funds to follow residents into assisted living settings — a key factor in middle-market accessibility.