Navigating the A, B, and C Asset Classes of Senior Living Investments
A practical framework for evaluating risk, value, and upside across senior housing assets.

1. Introduction: The Framework of Senior Housing Classification
In the current investment landscape, senior housing is no longer a monolithic sector. To navigate a market currently defined by extreme bifurcation—ranging from record-breaking institutional pricing to distressed "value-add" opportunities—investors must utilize a rigorous classification system. These Class A, B, and C designations are not merely aesthetic labels; they are leading indicators of capital stack durability, operational resilience, and risk-adjusted return potential in a high-interest-rate environment.
While the broader sector average price for assisted living (AL) reached a record $268,600 per unit in 2025—a staggering 60% year-over-year improvement—this growth is not distributed equally. To identify where an asset sits on the performance spectrum, we evaluate three primary criteria:
- Age (Vintage): The defining line for modern institutional appetite. Newer properties (2018+) require significantly less defensive CapEx and align with current consumer preferences for wellness-focused design.
- Size: A critical driver of operational leverage. Larger communities offer the economies of scale necessary to offset rising fixed costs, though they demand more sophisticated clinical and hospitality management.
- Location: The ultimate arbiter of rate-push potential. High-barrier-to-entry markets with affluent demographics allow operators to preserve margins against inflationary shocks.
These physical and demographic hallmarks are the primary determinants of an asset’s economic resilience and its ability to maintain a "stabilized" status in a competitive market.
--------------------------------------------------------------------------------
2. Class A: The Institutional Standard of Excellence
Class A assets represent the apex of the market, typically defined by a newer vintage (properties built in 2018 or later) and high-quality construction. These assets are strategically concentrated in affluent MSAs where residents can absorb premium private-pay rates. A prime example is The Residence at Selleck’s Woods in Darien, CT; its value is underpinned not just by luxury finishes, but by a location visible to hundreds of thousands of cars daily on I-95, creating a natural marketing moat. Similarly, assets like Grand Living at Tamaya in Jacksonville, FL, dominate their submarkets by offering a full continuum of care (IL/AL/MC) that competitors cannot easily replicate.
The "So What?" of Class A Performance
Institutional buyers, particularly REITs like Welltower and National Health Investors (NHI), are aggressively targeting Class A for three strategic reasons:
- Inflationary Shield: High-income residents provide operators the "pricing power" to pass through labor and food cost increases without risking a census collapse.
- Structural Supply Shortage: A multi-year lull in new construction has left these "newer" communities without local competition, allowing them to capture the lion's share of market demand.
- Capital Market Liquidity: These assets attract the most favorable financing terms (such as Freddie Mac floating-rate loans) and the largest pool of institutional bidders.
Class A Performance Profile (2025 Data)
Metric
Data Point
Average Price Per Unit
$436,700
Market Share Growth
18% (2023) to 37% (2025)
Key Advantage
Unrivaled operational resilience against staffing and inflation shocks
While Class A represents the high-water mark of the sector, the middle market presents a more complex set of operational hurdles and "turnaround" narratives.
3. Class B and C: The Middle Market and Alternative Use Assets
Class B and C assets represent the industry’s "legacy" stock. Class B is the traditional middle market, while Class C consists of older vintages (1960s–1970s) that often face terminal obsolescence. These properties are currently battling severe headwinds, most notably the rise of home health care, which offers a lower-cost alternative to aging physical plants.
The "So What?" for this segment is a matter of pricing elasticity: Class C properties are strictly limited in the rate increases they can push. Attempting to match Class A rate hikes often leads to a "disconnect" between price and quality, resulting in rapid de-manning and lost occupancy.
Strategic Paths for Underperforming Assets
Despite these challenges, sophisticated strategists utilize three primary paths to stabilize these assets:
- Value-Add Potential: Buying at a superb discount to replacement cost, allowing for a renovation budget that can bridge the gap to Class B+ status.
- Alternative Use: Transitioning non-viable "C" communities to behavioral health or multifamily. A notable example is Calaroga Terrace in Portland, which was acquired by a developer specifically for multifamily conversion.
- Medicaid Leverage: In markets like Ohio, operators are stabilizing margins by leaning into Medicaid Waiver occupancy. This is a policy-driven play; Ohio, for instance, significantly increased its AL waiver rates recently, making the lower-income model more sustainable.
The divergence in operational viability between these classes has created a historic valuation gap that defines the 2025 market.
4. The Valuation Gap: How Classification Dictates Market Value
The 2025 market is characterized by a record "Stability Spread." Stabilized assets (85%+ occupancy) reached an average of $334,300 per unit, while non-stabilized, older Class B/C assets stagnated at 111,400. This **222,900 spread** is the largest on record, signaling that buyers are no longer willing to "pay for potential" without a significant discount.
2025 Senior Housing Pricing Disparity
Property Class
Average Price Per Unit
% Change (Year-over-Year)
Class A
$436,700
61% Increase
Class B
$129,300
10% Increase
Class C
$65,600
Minimal Change (<$1,000)
The Role of Operating Margins
Classification is essentially a proxy for EBITDAR health. The market values these margins with extreme precision:
- High-Performance Tier (23%–40% Margins): Valued at an average of $354,300 per unit. Buyers view these as "plug-and-play" institutional assets.
- Distressed Tier (Below 10% Margins): Pricing fell to $86,400 per unit. This decline reflects intense buyer conservatism regarding "turnaround projects" that require heavy lifting in a high-labor-cost environment.
Beyond the individual asset, classification also dictates whether an investor can capture the elusive "portfolio premium."
5. Investment Trends: REITs, Portfolios, and Market Momentum
In 2025, the "portfolio premium" returned with a vengeance, but only for top-tier assets. Class A portfolios commanded an average of $618,400 per unit—nearly 87% higher than single-asset deals. Conversely, Class B portfolio prices actually fell year-over-year to $127,300. This confirms that the premium is reserved for quality and scale; buyers will pay for a platform of Class A assets but avoid paying premiums for portfolios of "non-performers" with disparate operational needs.
Core Market Drivers fueling Momentum:
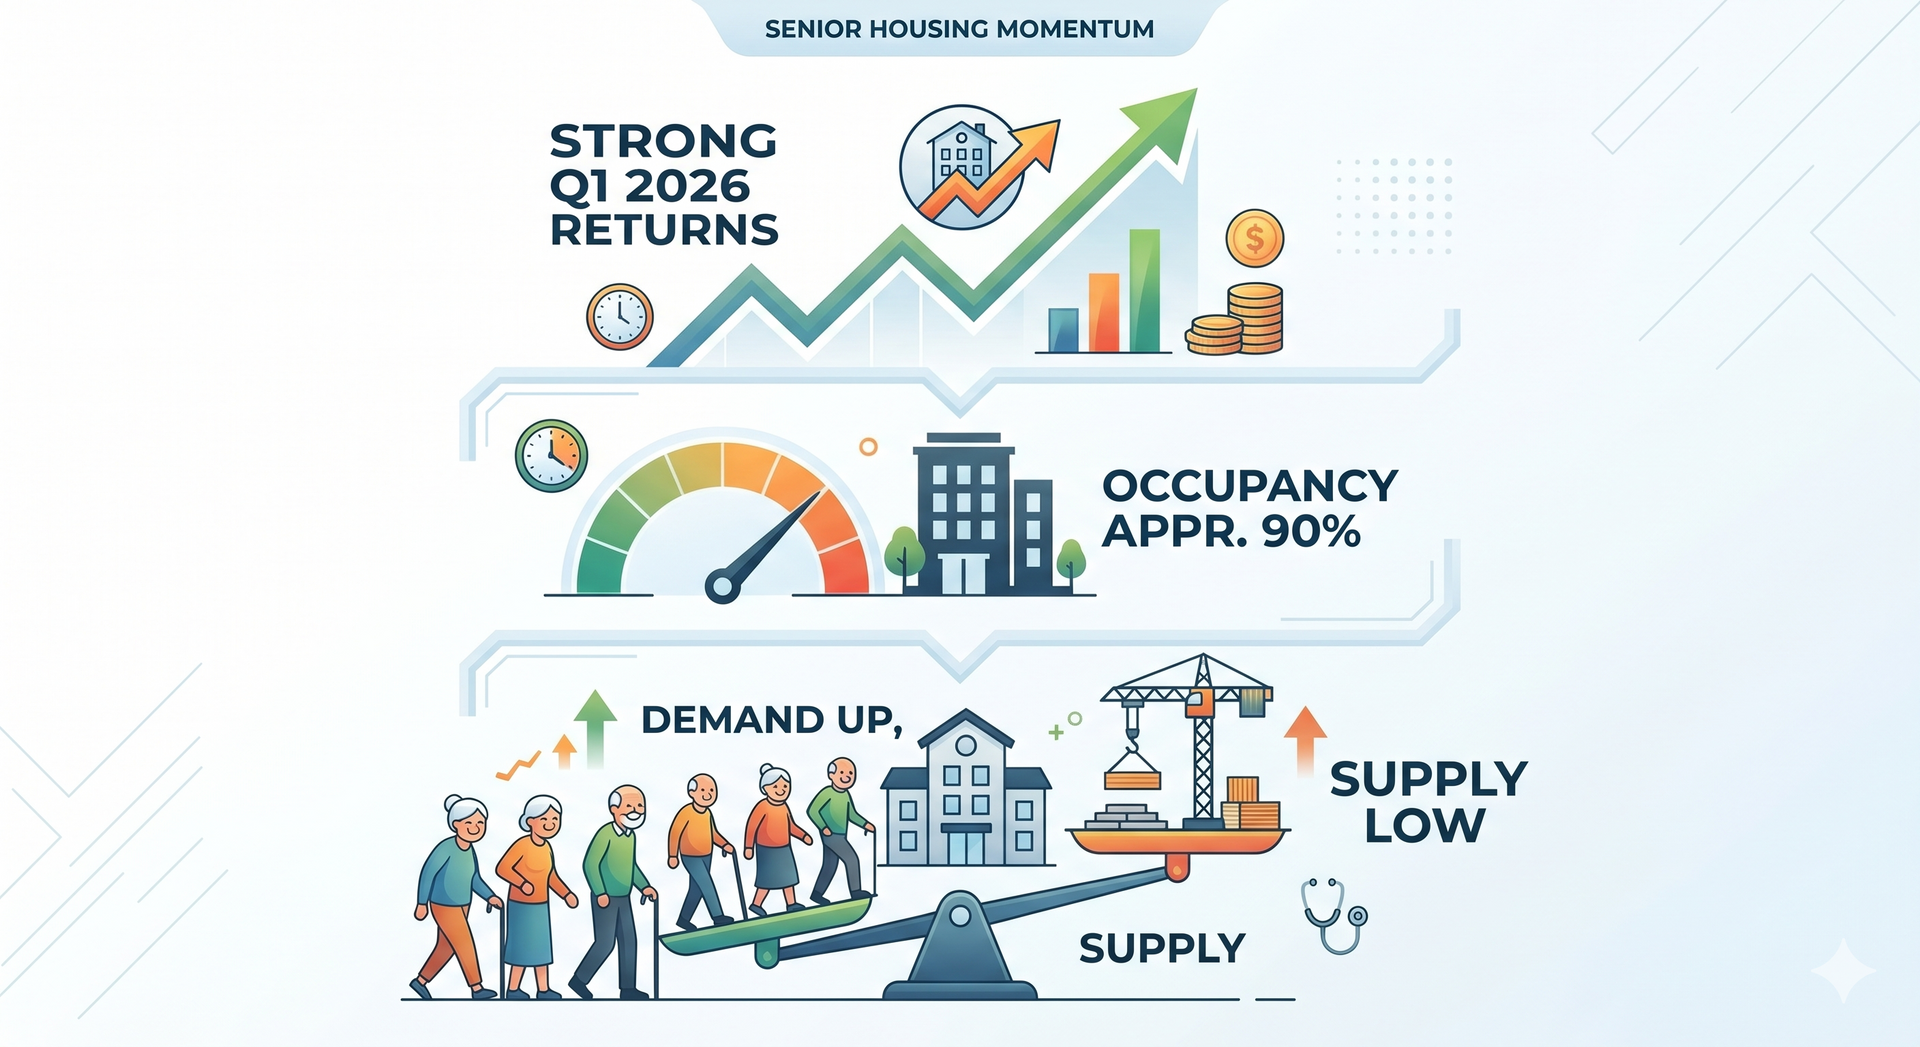
- Improving Occupancy: Industry averages reached 89.1% by Q4 2025, the highest level since 2015.
- Favorable Supply-Demand: With construction starts plummeting, existing high-quality assets face almost no new competition.
Takeaway: For the aspiring learner, understand that asset quality (Class A) is the primary driver of capital market liquidity. While Class A portfolios are seeing record-breaking premiums, Class B and C assets are often restricted to cash-heavy buyers or specialized "value-add" shops. Quality is the only true defense against capital market upheaval.
6. Summary and Checklist for the Aspiring Learner
Understanding the distinctions between A, B, and C is the "complete picture" required to evaluate senior care finance. A property's class dictates its debt capacity, its exit cap rate, and its ability to withstand the next economic cycle.
Investor's Rapid Audit
- [ ] Vintage: Is it a modern build (2018+) or a legacy asset (1960s-1970s)?
- [ ] Location: Is it in an affluent MSA with high visibility (e.g., I-95 corridor) or a low-barrier market with "rate-push" limits?
- [ ] Continuum of Care: Does it offer the full IL/AL/MC spectrum to capture the "aging in place" demand?
- [ ] Margin Warning: Is the EBITDAR margin above 20%? If it is 100% occupied but below 10% margin, the property is a "non-performer" hidden by high census.
- [ ] Stability Spread: Is the price per unit aligned with the 222,900 premium for stabilized assets, or is it priced as a risky turnaround (86,400)?
Successful investment in this sector requires identifying the point where physical quality meets operational efficiency. In 2026 and beyond, the gap between the "best" and the "rest" will only continue to widen.

Recent Posts